Grid section
For the grid section, you need a query that selects multiple fields. For more info on how to write queries, check the query differences for database and query examples
Basic example
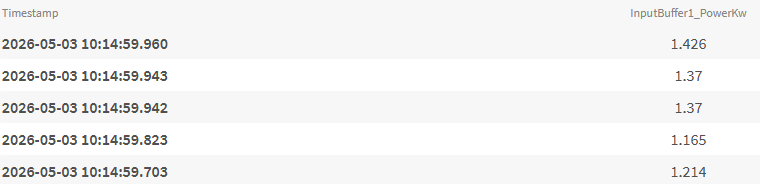
This example retrieves time-series data for a single field (InputBuffer1_PowerKw) over a 15-minute period. The query fetches the timestamp and power value for the 5 most recent records, ordered from newest to oldest. Each database type uses its own syntax to access the same data.
SELECT time, "InputBuffer1_PowerKw"
FROM "oneWeek"."Line1"
WHERE time >= '2026-05-03T10:00:00+02:00'
AND time < '2026-05-03T10:15:00+02:00'

ORDER BY time desc
LIMIT 5
SELECT time, inputbuffer1_powerkw
FROM "docsdemo_timescale_wide"."line1"
WHERE "inputbuffer1_powerkw" is not null
AND time >= '2026-05-03 10:00:00+02'
AND time < '2026-05-03 10:15:00+02'
ORDER BY time desc
LIMIT 5
SELECT time, value
FROM "line1"
WHERE name = 'InputBuffer1_PowerKw'
AND time >= '2026-05-03 10:00:00+02'
AND time < '2026-05-03 10:15:00+02'

ORDER BY time desc
LIMIT 5
WITH wide_data AS (
SELECT
time,
MAX(CASE WHEN name = 'InputBuffer1_PowerKw' THEN value END) AS "inputbuffer1_powerkw"
FROM "line1"
WHERE time >= '2026-05-03 10:00:00+02'
AND time < '2026-05-03 10:15:00+02'
GROUP BY time, tags
ORDER BY time desc
)

SELECT "time" AS "Time", "inputbuffer1_powerkw"
FROM wide_data
WHERE "inputbuffer1_powerkw" is not null
LIMIT 5
Multiple fields with aggregation
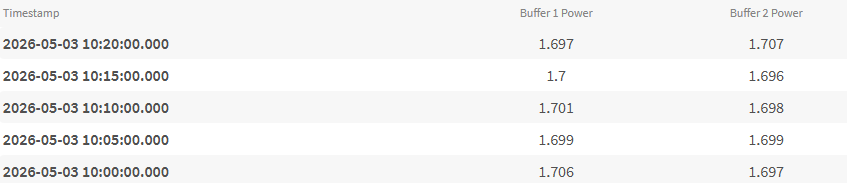
This example shows how to select multiple fields with aliases and group them by average value over 5-minute intervals. This is useful for comparing trends between different measurements over time.
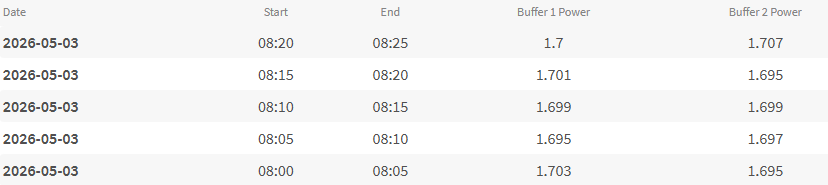
Timescale can split date and time
Unlike InfluxDB, Timescale supports advanced date/time formatting functions that allow you to split timestamps into separate Date, Start, and End columns. This makes it easier to create more readable reports without needing additional formatting in your reporting tool.
SELECT
  time AS "Time",
  MEAN("InputBuffer1_PowerKw") AS "Buffer 1 Power",
  MEAN("InputBuffer2_PowerKw") AS "Buffer 2 Power"
FROM "oneWeek"."Line1"
WHERE time >= '2026-05-03T10:00:00+02:00'
  AND time < '2026-05-03T10:25:00+02:00'
GROUP BY TIME(5m)
ORDER BY time DESC
LIMIT 5
SELECT
  TO_CHAR(time_bucket('5 minutes', time), 'YYYY-MM-DD') AS "Date",
  TO_CHAR(time_bucket('5 minutes', time), 'HH24:MI') AS "Start",
  TO_CHAR(time_bucket('5 minutes', time) + INTERVAL '5 minutes', 'HH24:MI') AS "End",
  AVG("inputbuffer1_powerkw") AS "Buffer 1 Power",
  AVG("inputbuffer2_powerkw") AS "Buffer 2 Power"
FROM "docsdemo_timescale_wide"."line1"
WHERE time >= '2026-05-03 10:00:00+02'
  AND time < '2026-05-03 10:25:00+02'
GROUP BY time_bucket('5 minutes', time)
ORDER BY time_bucket('5 minutes', time) DESC
LIMIT 5
WITH wide_data AS (
  SELECT
    time_bucket('5 minutes', time) AS bucket_time,
    AVG(CASE WHEN name = 'InputBuffer1_PowerKw' THEN value END) AS buffer1,
    AVG(CASE WHEN name = 'InputBuffer2_PowerKw' THEN value END) AS buffer2
  FROM "line1"
  WHERE time >= '2026-05-03 10:00:00+02'
    AND time < '2026-05-03 10:25:00+02'
    AND name IN ('InputBuffer1_PowerKw', 'InputBuffer2_PowerKw')
  GROUP BY bucket_time
)
SELECT
  TO_CHAR(bucket_time, 'YYYY-MM-DD') AS "Date",
  TO_CHAR(bucket_time, 'HH24:MI') AS "Start",
  TO_CHAR(bucket_time + INTERVAL '5 minutes', 'HH24:MI') AS "End",
  buffer1 AS "Buffer 1 Power",
  buffer2 AS "Buffer 2 Power"
FROM wide_data
ORDER BY bucket_time DESC
LIMIT 5
Calculated columns
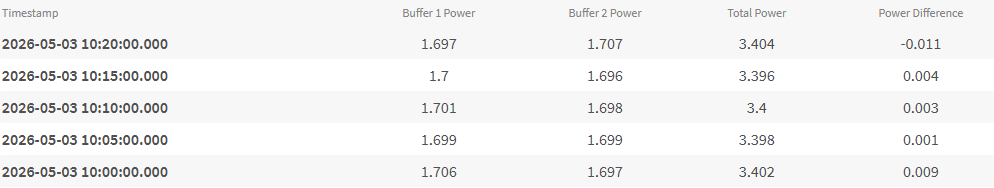 This example demonstrates how to create derived fields by performing calculations on existing data. Here we calculate the total power consumption and the difference between two buffers.
SELECT
  time,
  MEAN("InputBuffer1_PowerKw") AS "Buffer 1 Power",
  MEAN("InputBuffer2_PowerKw") AS "Buffer 2 Power",
  MEAN("InputBuffer1_PowerKw") + MEAN("InputBuffer2_PowerKw") AS "Total Power",
  MEAN("InputBuffer1_PowerKw") - MEAN("InputBuffer2_PowerKw") AS "Power Difference"
FROM "oneWeek"."Line1"
WHERE time >= '2026-05-03T10:00:00+02:00'
  AND time < '2026-05-03T10:25:00+02:00'
GROUP BY TIME(5m)
ORDER BY time DESC
LIMIT 5
SELECT time_bucket('5 minutes', time) AS "time",
  AVG("inputbuffer1_powerkw") AS "Buffer 1 Power",
  AVG("inputbuffer2_powerkw") AS "Buffer 2 Power",
  AVG("inputbuffer1_powerkw") + AVG("inputbuffer2_powerkw") AS "Total Power",
  AVG("inputbuffer1_powerkw") - AVG("inputbuffer2_powerkw") AS "Power Difference"
FROM "docsdemo_timescale_wide"."line1"
WHERE time >= '2026-05-03 10:00:00+02'
  AND time < '2026-05-03 10:25:00+02'
GROUP BY time_bucket('5 minutes', time)
ORDER BY time_bucket('5 minutes', time) DESC
LIMIT 5
WITH wide_data AS (
  SELECT
    time_bucket('5 minutes', time) AS bucket_time,
    AVG(CASE WHEN name = 'InputBuffer1_PowerKw' THEN value END) AS buffer1,
    AVG(CASE WHEN name = 'InputBuffer2_PowerKw' THEN value END) AS buffer2
  FROM "line1"
  WHERE time >= '2026-05-03 10:00:00+02'
    AND time < '2026-05-03 10:25:00+02'
    AND name IN ('InputBuffer1_PowerKw', 'InputBuffer2_PowerKw')
  GROUP BY bucket_time
)
SELECT
  bucket_time as "Time",
  buffer1 AS "Buffer 1 Power",
  buffer2 AS "Buffer 2 Power",
  buffer1 + buffer2 AS "Total Power",
  buffer1 - buffer2 AS "Power Difference"
FROM wide_data
ORDER BY bucket_time DESC
LIMIT 5
Multiple aggregations
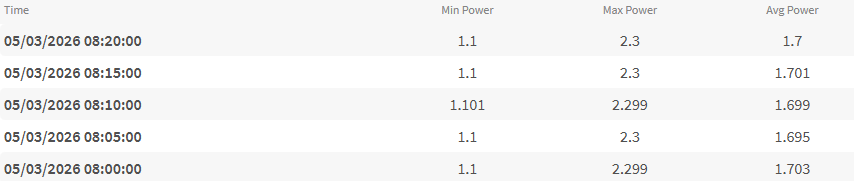
This example shows how to display minimum, maximum, and average values for the same field in each time period. This is useful for understanding data variability and identifying peak values.
SELECT
  time,
  MIN("InputBuffer1_PowerKw") AS "Min Power",
  MAX("InputBuffer1_PowerKw") AS "Max Power",
  MEAN("InputBuffer1_PowerKw") AS "Avg Power"
FROM "oneWeek"."Line1"
WHERE time >= '2026-05-03T10:00:00+02:00'
  AND time < '2026-05-03T10:25:00+02:00'
GROUP BY TIME(5m)
ORDER BY time DESC
LIMIT 5
SELECT
  time_bucket('5 minutes', time) AS "Time",
  MIN("inputbuffer1_powerkw") AS "Min Power",
  MAX("inputbuffer1_powerkw") AS "Max Power",
  AVG("inputbuffer1_powerkw") AS "Avg Power"
FROM "docsdemo_timescale_wide"."line1"
WHERE time >= '2026-05-03 10:00:00+02'
  AND time < '2026-05-03 10:25:00+02'
GROUP BY time_bucket('5 minutes', time)
ORDER BY time_bucket('5 minutes', time) DESC
LIMIT 5
WITH wide_data AS (
  SELECT
    time_bucket('5 minutes', time) AS bucket_time,
    CASE WHEN name = 'InputBuffer1_PowerKw' THEN value END AS power_value
  FROM "line1"
  WHERE time >= '2026-05-03 10:00:00+02'
    AND time < '2026-05-03 10:25:00+02'
    AND name = 'InputBuffer1_PowerKw'
)
SELECT
  bucket_time AS "Time",
  MIN(power_value) AS "Min Power",
  MAX(power_value) AS "Max Power",
  AVG(power_value) AS "Avg Power"
FROM wide_data
GROUP BY bucket_time
ORDER BY bucket_time DESC
LIMIT 5